← Back to Blog

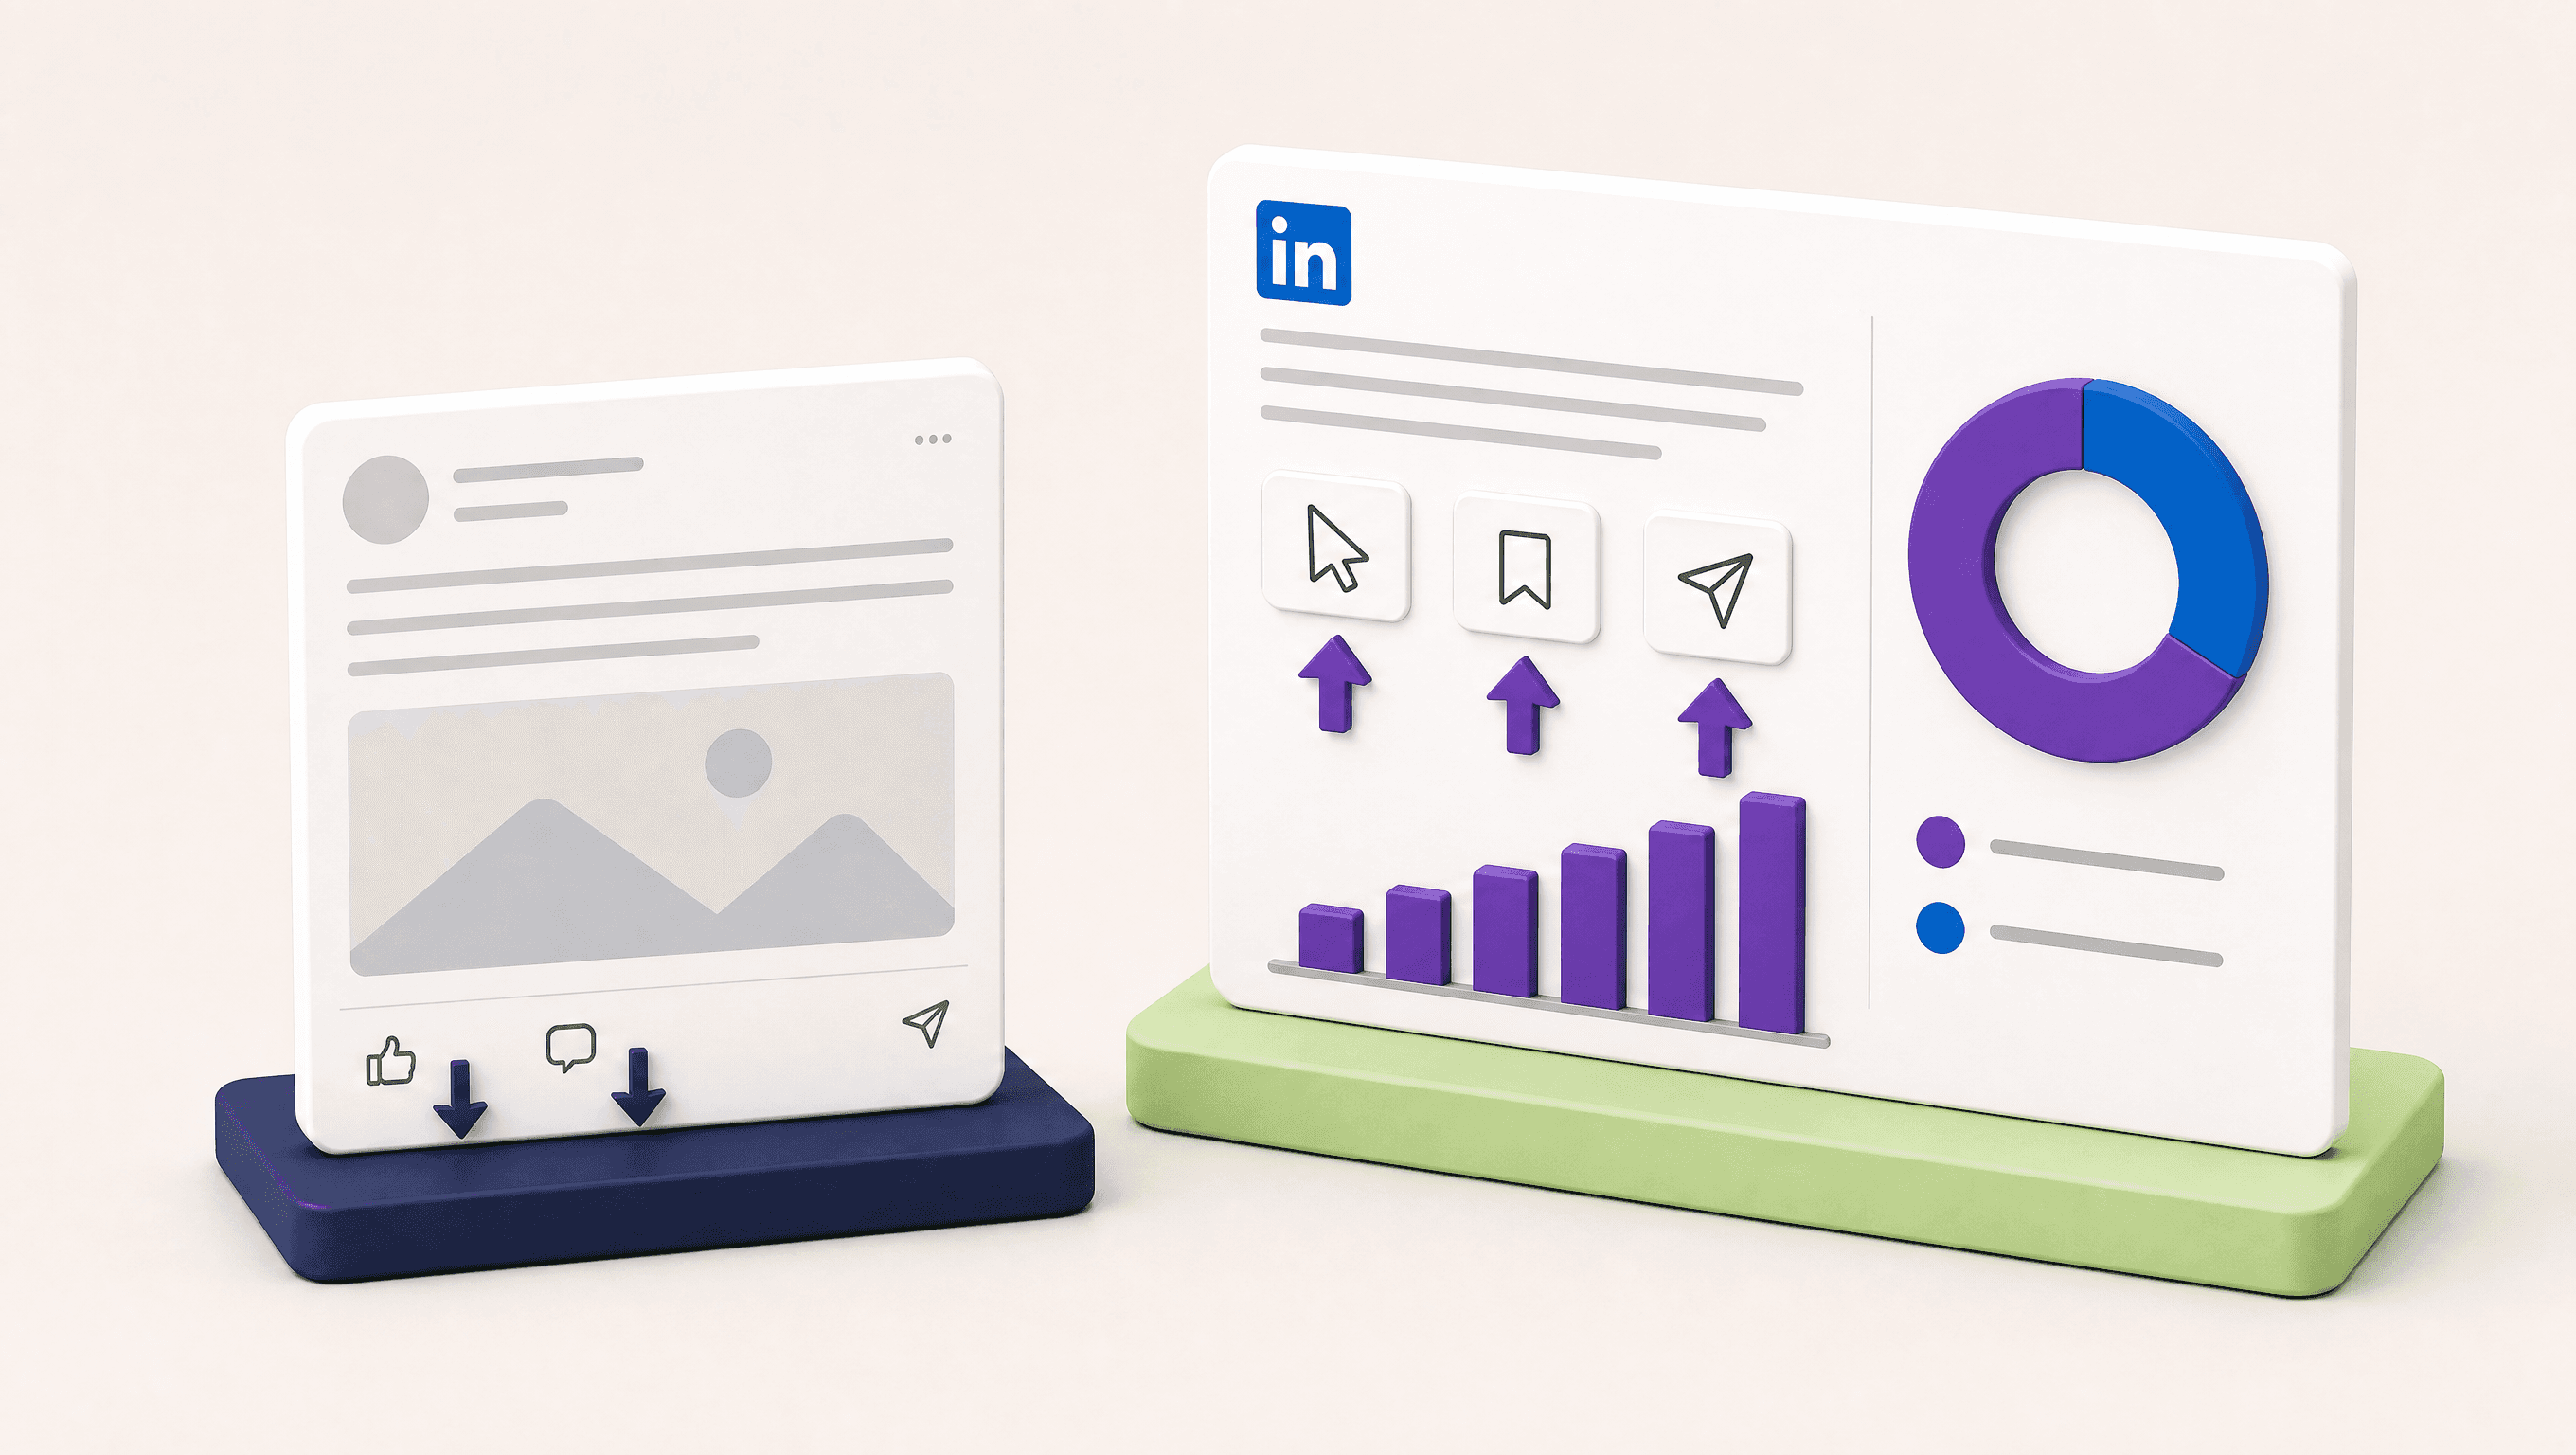
LinkedIn likes are falling while your audience gets busier. Here's what to count instead.
TL;DR: If your LinkedIn marketing strategy is judged on likes, it's judged on a number that's shrinking. Metricool's study of 673,658 posts found that in January-February 2026, likes fell 13%, comments 17% and shares 10% year over year, while clicks rose 5%. The five metrics worth putting in your monthly report are clicks, saves and sends, out-of-network reach, profile views, and who actually saw the post. Report personal profiles and company pages separately, because LinkedIn counts clicks inside the engagement rate for Pages.
Somewhere right now, a marketing manager is presenting a slide where the likes line points down and the CEO is asking what went wrong. Probably nothing did. In the same period the likes dropped, the average LinkedIn post got more clicks, rising from 97.54 to 102.32 per post.
I'm Hanita Yudovski. I run LinkedIn programs for B2B companies and ghostwrite posts for some of their CEOs, which means I have a stake here: when likes go down, "let's measure something else" is a very convenient thing for someone like me to say. So every metric below comes with where to find it in LinkedIn analytics and what it can't prove, and your LinkedIn marketing strategy ends up resting on numbers you can defend in that CEO meeting.
What actually dropped, and what grew
Metricool, a social media scheduling and analytics company (so a vendor with an interest in you measuring more), analyzed 673,658 posts from 63,108 accounts worldwide, comparing January-February 2025 with January-February 2026. According to its April 2026 study announcement:
Likes: down 13%
Comments: down 17%
Shares: down 10%
Clicks: up 5%
Overall engagement: up nearly 14%
Metricool calls the growth "invisible interactions": link clicks, carousel swipes and video views that the audience does without anyone else in the feed seeing them. CEO and co-founder Juan Pablo Tejela put the takeaway plainly: "The challenge now is understanding which metrics actually reflect impact and building content strategies around that shift."
One detail that rarely makes the headlines: over the same period, average posts per week dropped by nearly 10%. Fewer posts, each getting more clicks. My read (the study doesn't test this) is that some of the gain may simply be less competition for the same feed.
Why "engagement went up" is only half the story
For company Pages, LinkedIn's Help Center defines engagement rate as interactions divided by impressions, and interactions include clicks, reactions, comments and shares. Clicks are baked into the formula.
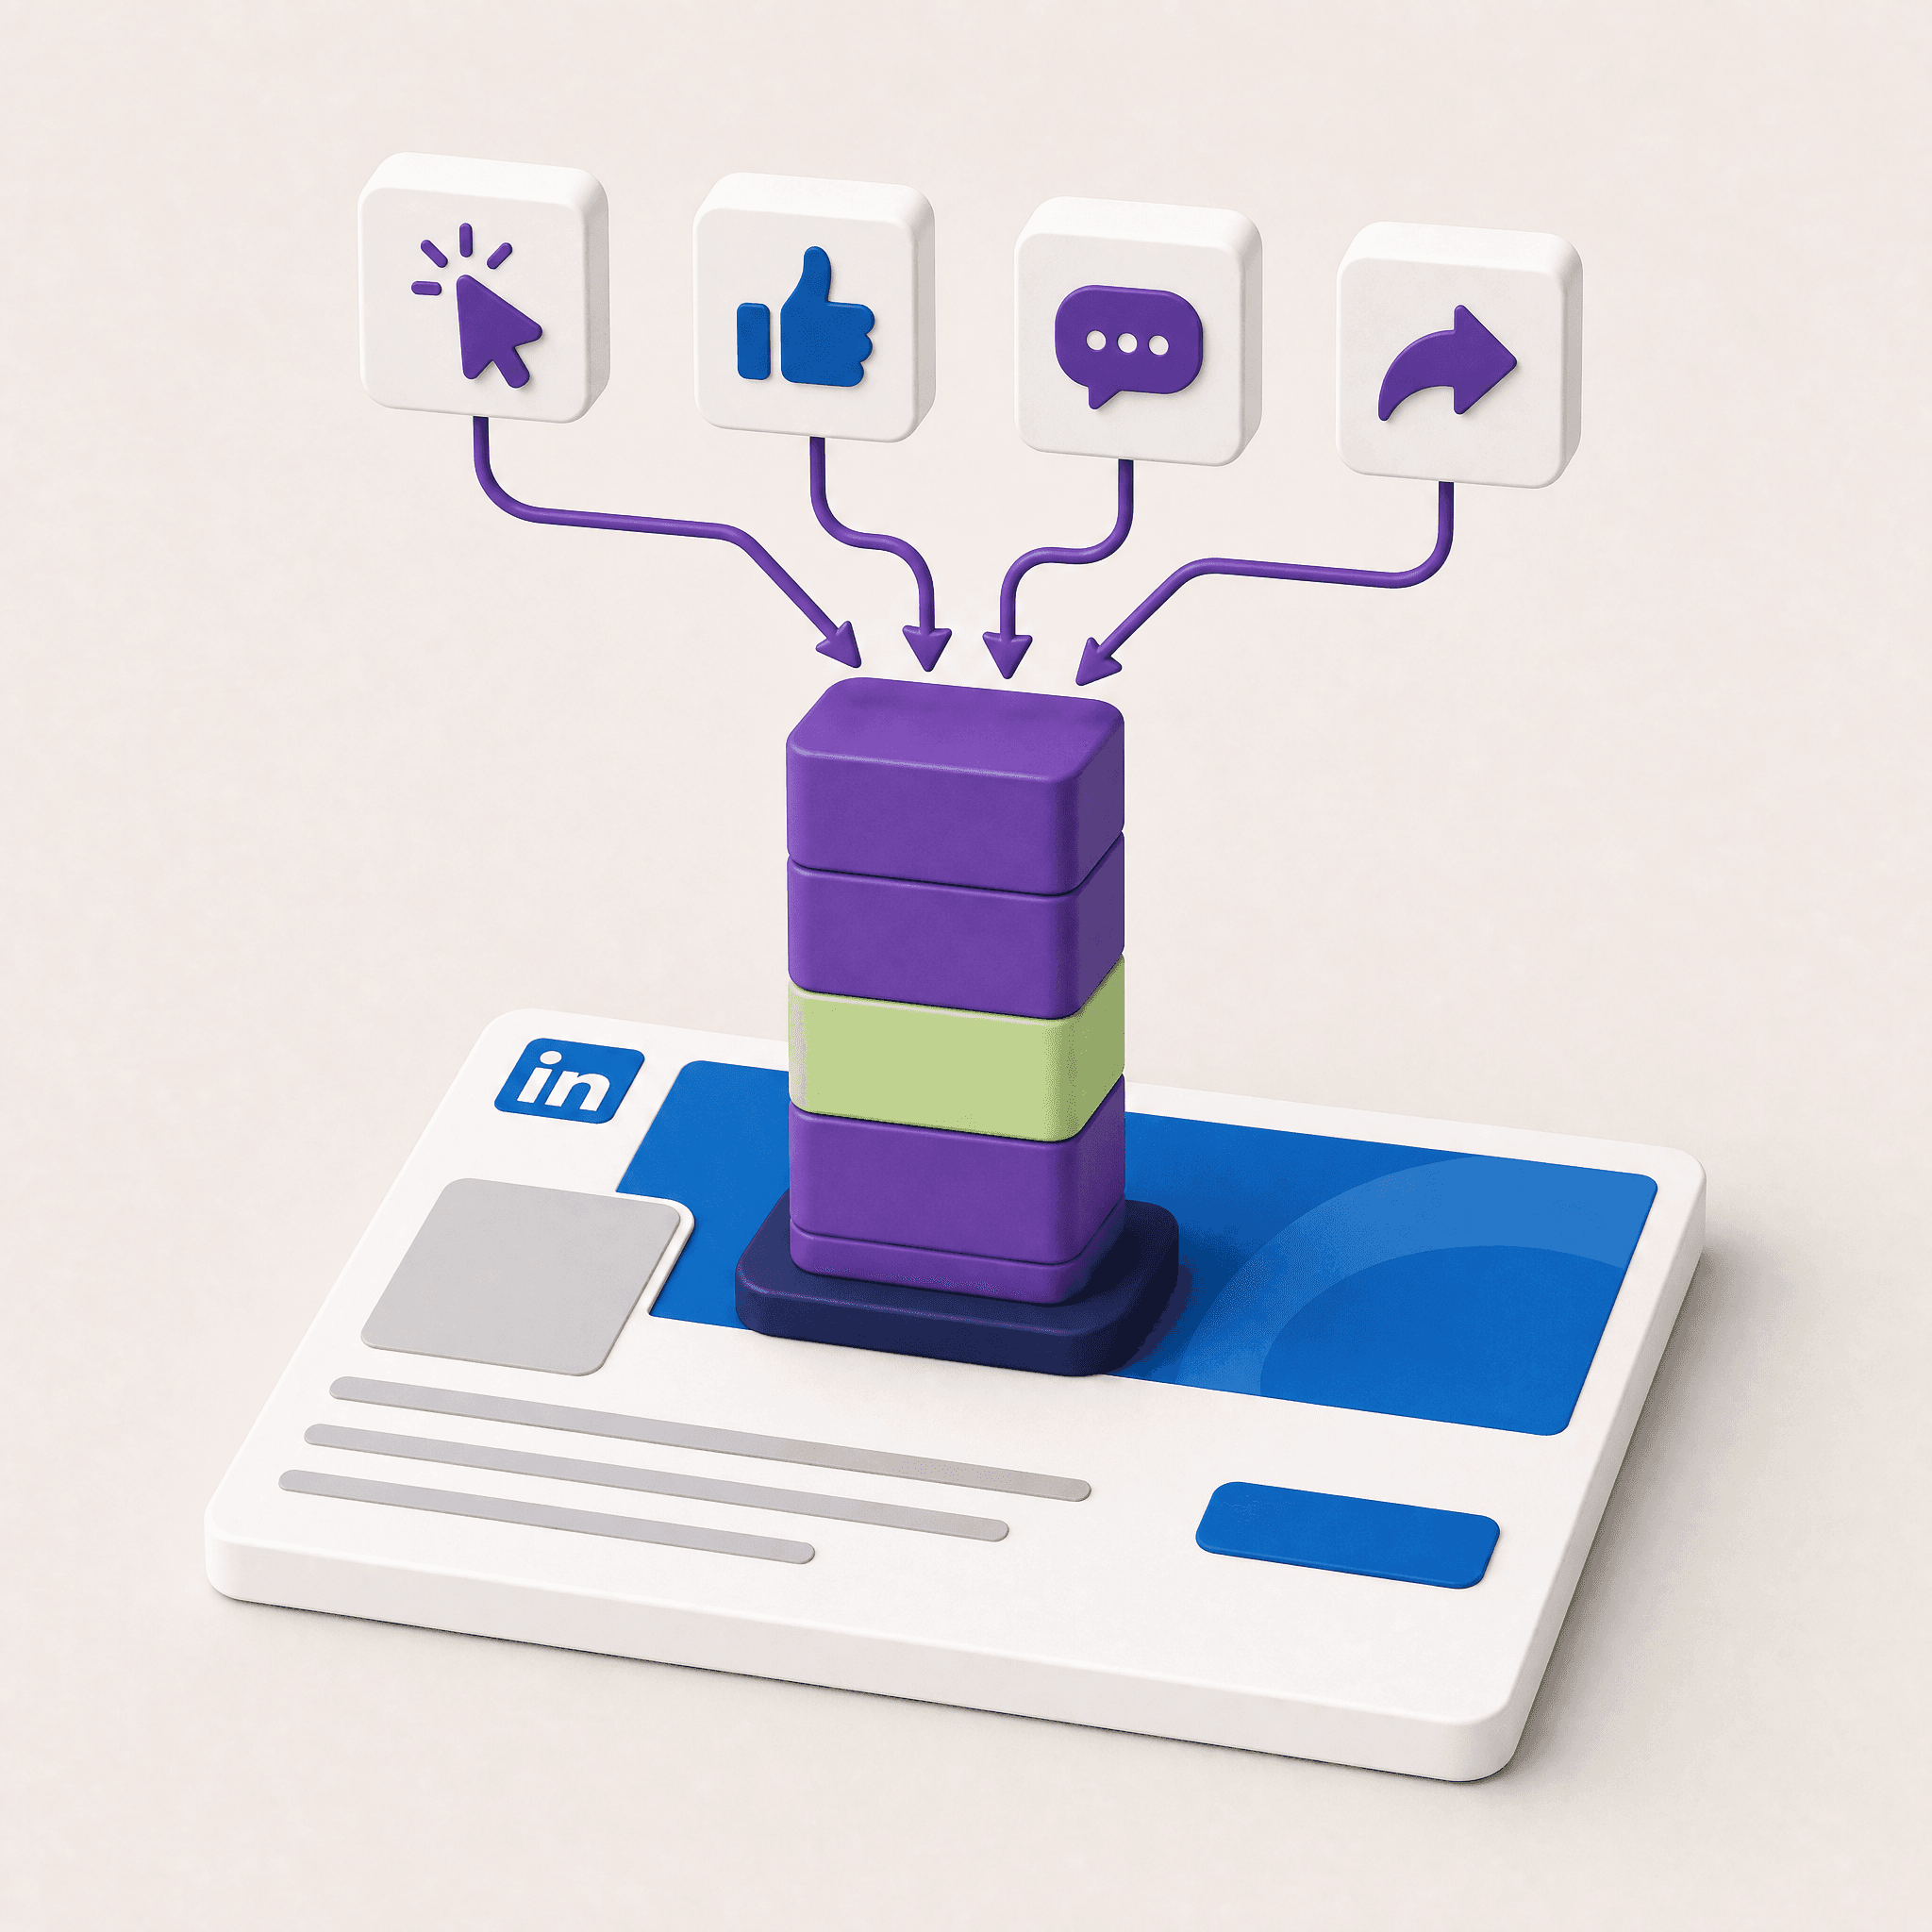
In July 2026, Beth Carter, founder of the agency Lemon Squeezy Marketing, tested one of Metricool's findings (that link posts on company Pages get 51% more impressions) against six months of data from two clients. For her B2B tech client, link posts got fewer reactions, comments and clicks than posts without links. Her explanation: "LinkedIn counts clicks as interactions for company pages in a way it doesn't for personal profiles." A link post that people clicked but nobody reacted to can look like a high-engagement post in the data.
Two clients is a small sample next to half a million posts. The formula point stands on its own, though, because it comes from LinkedIn's own documentation.
What LinkedIn says its feed actually models
In March 2026, Hristo Danchev published a detailed look at the new feed ranking system on LinkedIn's engineering blog. The model predicts two kinds of behavior: passive ones (click, skip, long dwell) and active ones (like, comment, share).
Saves aren't on that list.
That matters because one of the most repeated LinkedIn claims of 2026 is that a save is worth five times a like. I went looking for that number in Metricool's published study pages, where it's usually attributed, and couldn't find it. It may come from another analysis. Until someone shows a primary source, I wouldn't build a strategy on the multiplier.
Here's what is documented: since September 2025, post analytics show how many times a post was saved and how many times it was sent in a private message. Saves earn a spot in your report for what they tell you about the content. How much weight they carry in ranking, LinkedIn hasn't said. For the full picture of how the feed works this year, see the LinkedIn algorithm in 2026.
Five LinkedIn analytics metrics for your monthly report
Metric | Where to find it | What it tells you | What it can't prove |
|---|---|---|---|
Clicks per post | Post analytics, Link engagement | Whether the post made someone act | That the person clicking is a buyer |
Saves and sends | Post analytics, Social engagement | Whether the post was useful enough to keep or pass on | That the algorithm rewards them |
Out-of-network reach | Post analytics, Discovery | Whether you reached people who don't know you yet | That those new people are your audience |
Profile views | Post analytics, Profile activity | Whether the post made people curious about the author | Buying intent |
Who saw it | Post analytics, Post viewer demographics | Whether viewers match the audience your strategy targets | That they'll ever reach out |
Section names come from LinkedIn's post analytics guide.
The newest metric here is out-of-network reach. In June 2026 LinkedIn began rolling out a split between views from inside your network (connections and followers) and views from people outside it. Sam Corrao Clanon, LinkedIn's Director of Creator Products, described it as showing whether a post travels to new people through feed recommendations, reshares and search. In my opinion it's the most underused number in small B2B companies' reports, because a 20-person company's CEO runs out of network fast.
What moves to the bottom of the report? Likes, and follower counts without context. LinkedIn's model still predicts likes, so they're still a signal. They just shouldn't be the first line anyone reads.
Personal profiles and company pages need separate reports
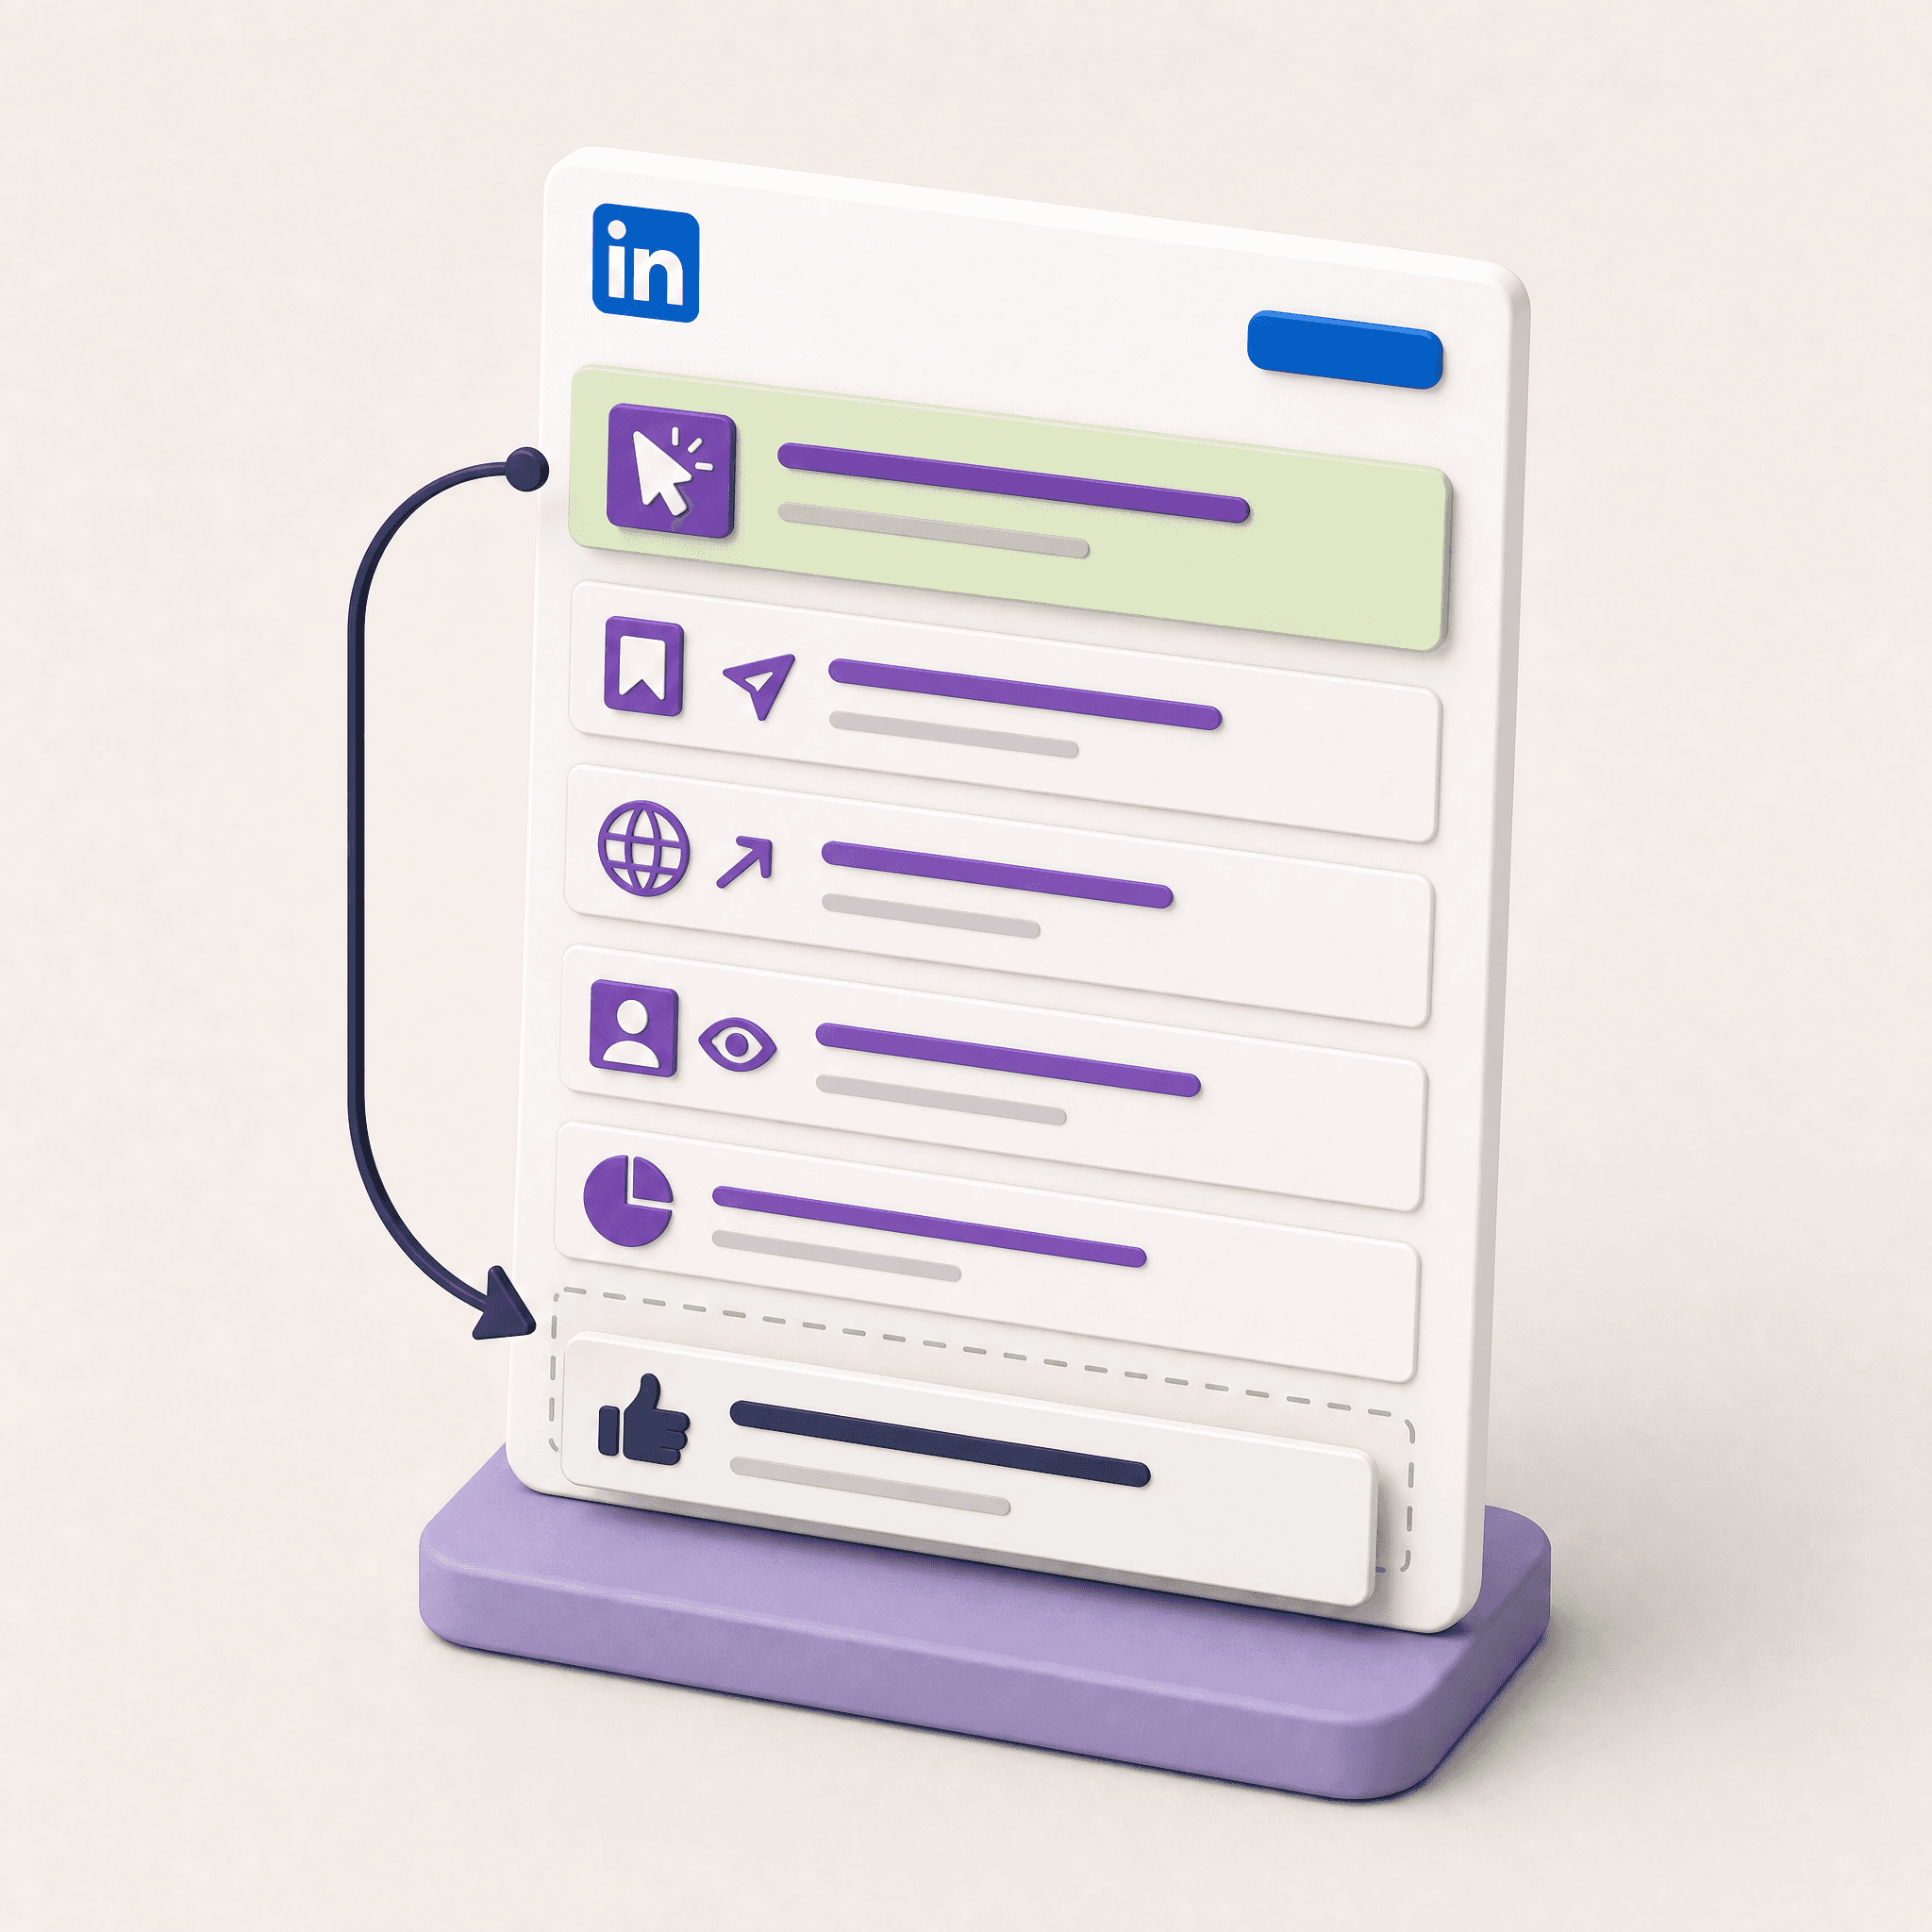
In Metricool's data, personal profiles averaged a 2.60% engagement rate against 1.60% for company Pages, with similar impressions per post, and that gap exists even with clicks counted inside Page engagement. Profiles drive more comments per post, Pages drive more shares.
Links behave differently too. Per Metricool, link posts on company Pages got 51% more impressions, while on personal profiles they got 27% fewer. Given Carter's test, I'd check the Page half against your own Page before changing anything.
In practice: lead the personal profile report with comments, profile views and out-of-network reach. Lead the Page report with clicks and shares, and note how many came from link posts. If your Page feels like it's "not working," I wrote about why the feed and AI engines both favor the CEO's profile.
How to build the report
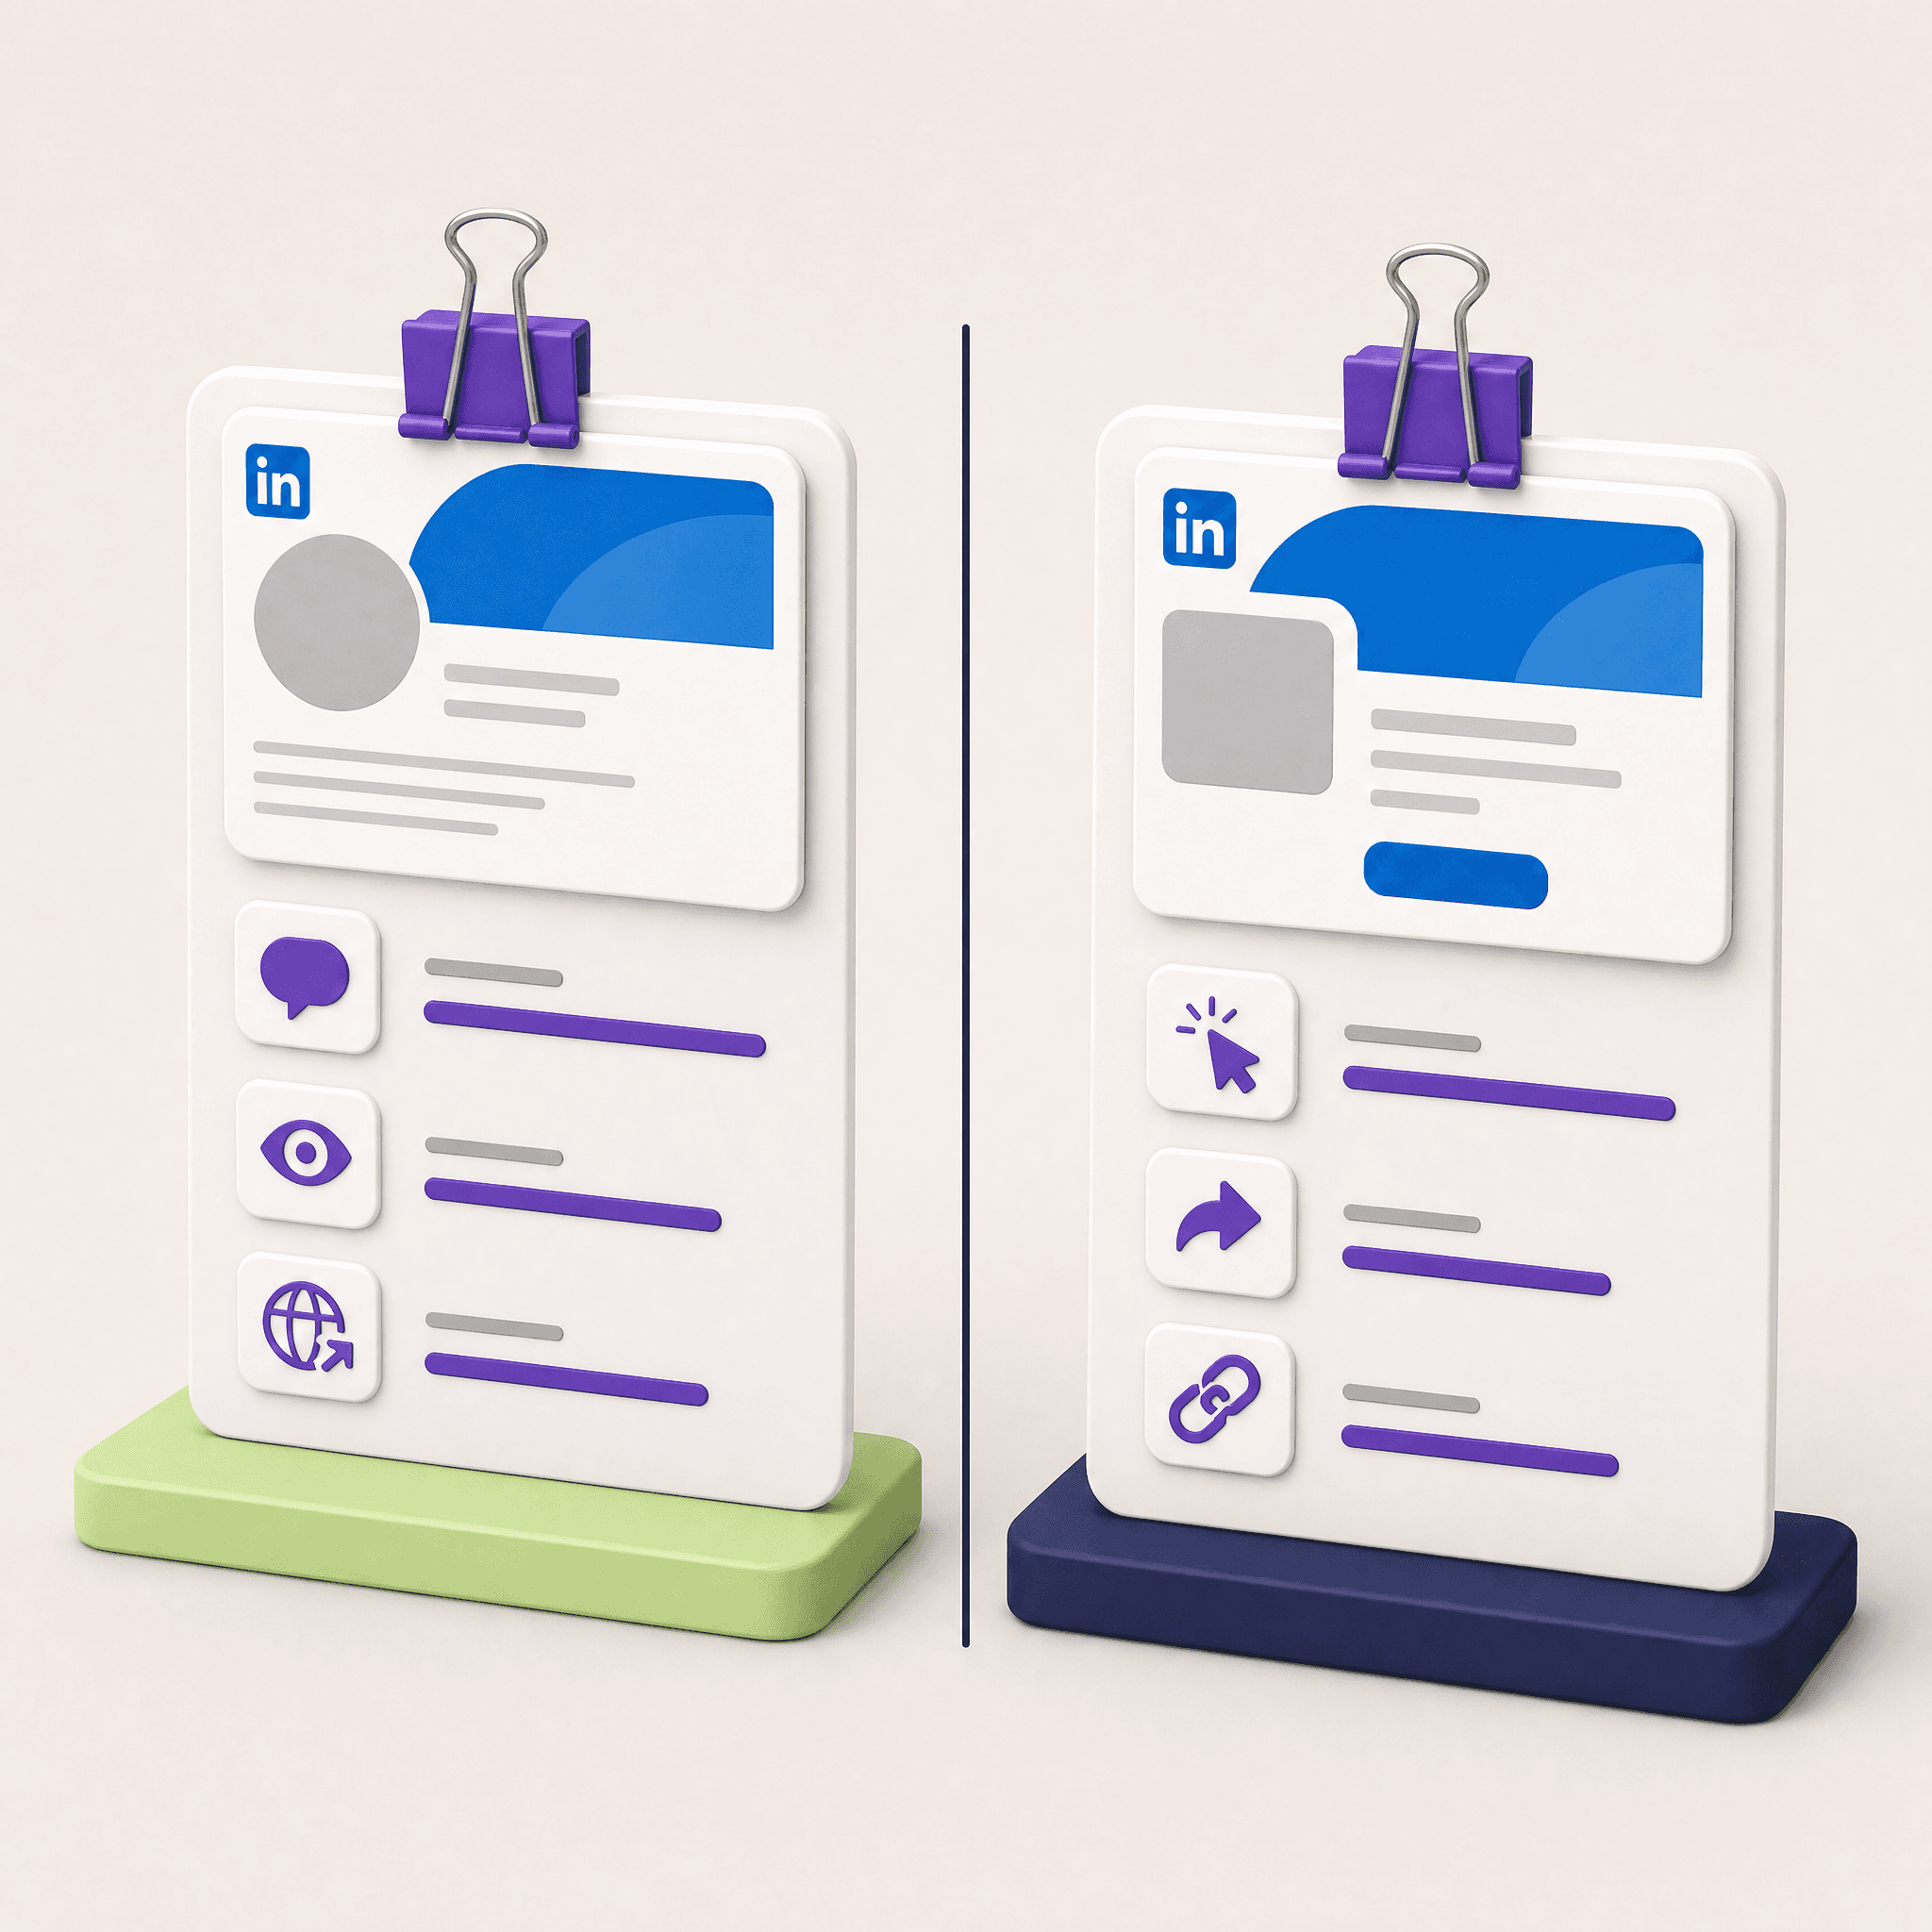
Wait a week after publishing → pull the five metrics for every post → flag the top three by clicks and saves → check who saw them → plan next month's posts on those topics, using structures that already proved themselves.

Why a week? Metricool found that 50% of impressions arrive in the first 48 hours, which means the other half arrives later. Measure on day two and you're looking at roughly half the post's reach (that's my arithmetic on their figure, and pace varies post to post).
This report answers whether the content side of your LinkedIn marketing strategy works. Whether LinkedIn produces deals is a separate question with a slower clock, and I cover it in the four-rung ladder from saves to influenced pipeline. If you want both reports run by the same person, that's what the LinkedIn Growth Engine is for (yes, that's what I sell).
Bottom line
Likes on LinkedIn are falling, and clicks, saves and reach beyond your network are where you can now see whether content works. If you're reviewing your LinkedIn marketing strategy this quarter, start with one change in your next report: move likes to the last row and put out-of-network reach at the top.
If LinkedIn hid like counts tomorrow, how would you know your last post worked?
FAQ
Which LinkedIn metrics matter most in 2026?
Clicks per post, saves and sends, out-of-network reach, profile views, and the demographics of who saw the post. Metricool's study of 673,658 posts found likes down 13% and clicks up 5% in early 2026 compared with early 2025, so likes alone give a partial picture.
Do saves affect the LinkedIn algorithm?
LinkedIn hasn't published how much weight saves carry in ranking. Its March 2026 engineering post on the feed model lists click, skip, long dwell, like, comment and share, and doesn't mention saves. Save and send counts have been visible in post analytics since September 2025.
Why are LinkedIn likes down?
According to Metricool, comparing January-February 2026 with the same period in 2025, likes fell 13%, comments 17% and shares 10%, while clicks rose 5% and overall engagement rose nearly 14%. Activity shifted toward interactions others can't see, such as link clicks, carousel swipes and video views. Average posts per week also dropped nearly 10%.
How is LinkedIn engagement rate calculated?
For company Pages, LinkedIn's Help Center defines engagement rate as interactions divided by impressions, with interactions including clicks, reactions, comments and shares. Because clicks are included, a link post can show high engagement with few comments.
Where do I see out-of-network reach on LinkedIn?
In your post analytics, under Discovery, which splits views between people in your network (connections and followers) and people outside it. LinkedIn began rolling out this split in June 2026.
Should I compare engagement between a personal profile and a company page?
Keep two separate reports. Page engagement rate includes clicks, and even so Metricool found personal profiles averaging 2.60% against 1.60% for Pages. Lead the profile report with comments and profile views, and the Page report with clicks and shares.
Written by Hanita Yudovski, who runs LinkedIn programs for B2B companies, from the CEO's profile to employee advocacy, and helps independent professionals build their LinkedIn presence. LinkedIn is where she works every day, with AI agents and tools she builds herself. Updated September 2026. Written with AI tools, human strategy and human editing.
Sources: Metricool: 2026 LinkedIn study announcement · Metricool: LinkedIn trends from the 2026 study · LinkedIn Help: Content analytics for your LinkedIn Page · LinkedIn Help: View post analytics for your content · LinkedIn Engineering: Engineering the next generation of LinkedIn's feed · Social Media Today: saves and sends in post analytics · Net Influencer: LinkedIn's new reach metric · Lemon Squeezy Marketing: testing the company page link stat