← Back to Blog


A year of LinkedIn changes, sorted by month, with a source next to every number.
TL;DR: In 2026 LinkedIn stopped counting reactions and started measuring time and trust. One model, 360Brew, now ranks the feed, and every change this year is the same decision applied to a new surface. A post that holds readers for 61 seconds gets 15.6% engagement against 1.2% for one abandoned in 3 seconds (van der Blom, 1.3M posts). A save is worth 5x a like (Metricool, 673K posts). Over 1 million people hit the "Seems like AI slop" button in two weeks, and a flagged post loses roughly 40% of its out-of-network reach (LinkedIn, August). 75% of LinkedIn citations inside ChatGPT answers come from personal profiles (Meltwater). Overall organic reach is down 47% year over year (Search Engine Journal). Below: a month-by-month table, what gets rewarded, what gets punished, and a playbook.
LinkedIn in 2026 is a different platform from the one you learned in 2024, and if you still grade a post by its like count you are measuring something the algorithm stopped looking at.
I wrote about each of these changes as it happened, one at a time. The problem with writing in real time is that the full picture only shows up when you lay everything on one axis. I did that last week for a client who asked "what actually changed, in one sentence," and got a full page instead. That page is this article.
One disclosure before we start. I run LinkedIn for CEOs and founders, and for some of them I also write the posts (ghostwriting). So I have a stake in the personal profile beating the company page. Keep that in mind when you get to the Meltwater section, and check the numbers yourself. Sources are at the bottom.
Why 2026 is different from every year before it
Until late 2024 the LinkedIn algorithm was a stack of small models, each guessing one thing: whether you'd like, whether you'd comment, whether you'd scroll past. In March 2025 LinkedIn published a paper on a single language model called 360Brew (150 billion parameters, if that means anything to you) that reads the post and your history as text and decides what to show. Over 2026 that model became the only engine.
What changes in practice? Three things.
First, relevance over recency. A good post from two weeks ago can land in your feed today because it matches what you read yesterday. Second, the model understands topic, so a profile that writes about something different every week confuses it. Third, and this is the one that hurts: the model doesn't count taps, it measures behavior. How long you stayed, whether you saved, whether you opened "see more," whether you swiped through the carousel.
The result, per Search Engine Journal's August analysis: organic reach down 47% year over year, clicks down 42%. This is not a bug they'll fix, it's a preference of the system. Fewer posts per person, more time on each one.
What entered the algorithm in 2026, month by month
This table is the reason the article exists. Every row has a source, and every change I covered in real time is linked.
When | What changed | Who said it | Where I covered it |
|---|---|---|---|
January, ongoing | 360Brew becomes the sole ranking engine, dwell time and relevance over reactions | LinkedIn (research paper) | |
March | The median LinkedIn post cited by AI has 15 to 25 reactions and at most one comment | Semrush | |
May | Depth Score: 1.2% engagement at 3 seconds vs 15.6% at 61+ seconds | Richard van der Blom, 1.3M posts | |
May | A link in the post body cuts median reach by 18.8% | van der Blom | same |
May | Generic AI content suppressed, 94% classifier accuracy | LinkedIn (Laura Lorenzetti) | same |
May 12 | Advice Sessions launch, paid consulting from the profile | same | |
June 10 | Creator Marketplace launch | LinkedIn (Sam Corrao-Clanon) | |
June | Collab Posts, one post distributed to two networks | ||
June 22 | Live only through a scheduled Event | ||
June 24 | Topic feeds test, second attempt after the 2025 failure | Social Media Today | |
June 30 | Official AI-visibility guidance: 800 to 1,200-word articles, 200 to 300-word posts, ten quality comments | LinkedIn (Davang Shah, CMO) | same |
July 9 | 40.5% of long LinkedIn posts fully AI-written | Pangram Labs | |
July | Monetization roadmap: paid subscriptions (70% to the creator), paid events | LinkedIn / Social Media Today | |
July 30 | "Seems like AI slop" button on posts and comments | LinkedIn (Hari Srinivasan) | |
August 2 | Quarterly results: content consumption +10%, time in comments +18%, revenue +12% | Microsoft | not covered, lands here |
August 9 | Comments ranked by personal relevance, not time | ||
August | 1M slop reports in two weeks, roughly 40% less out-of-network reach, private analytics alert | same | |
August | "Enhance post" AI writer removed, proofreader only | ||
August 17 | 9.5M AI citations, 75% from personal profiles | Meltwater | |
August 19 | Organic reach down 47%, clicks down 42% | Search Engine Journal | same |
August | 673K posts: save = 5x a like, carousel = 11x an image, question +77% comments, company-page link +51% | Metricool | same |
August | SSI moves into Sales Navigator | same | |
September | Inauthentic-activity detection up 46%, Saves and Sends in analytics | not covered, lands here | |
September | AI-written posts get 2.8x less reach and 5x less engagement | van der Blom, Creator Science podcast | not covered, lands here |
What the algorithm rewards now
Reading time, before anything else
If you remember one number from this year, make it 1.2% versus 15.6%. Van der Blom measured 1.3 million posts between March and May and found that a post readers abandon within three seconds gets 1.2% engagement, and a post that holds them for 61 seconds or more gets 15.6%. Thirteen times. He called it Depth Score, LinkedIn never confirmed the name, but the feed behaves accordingly.
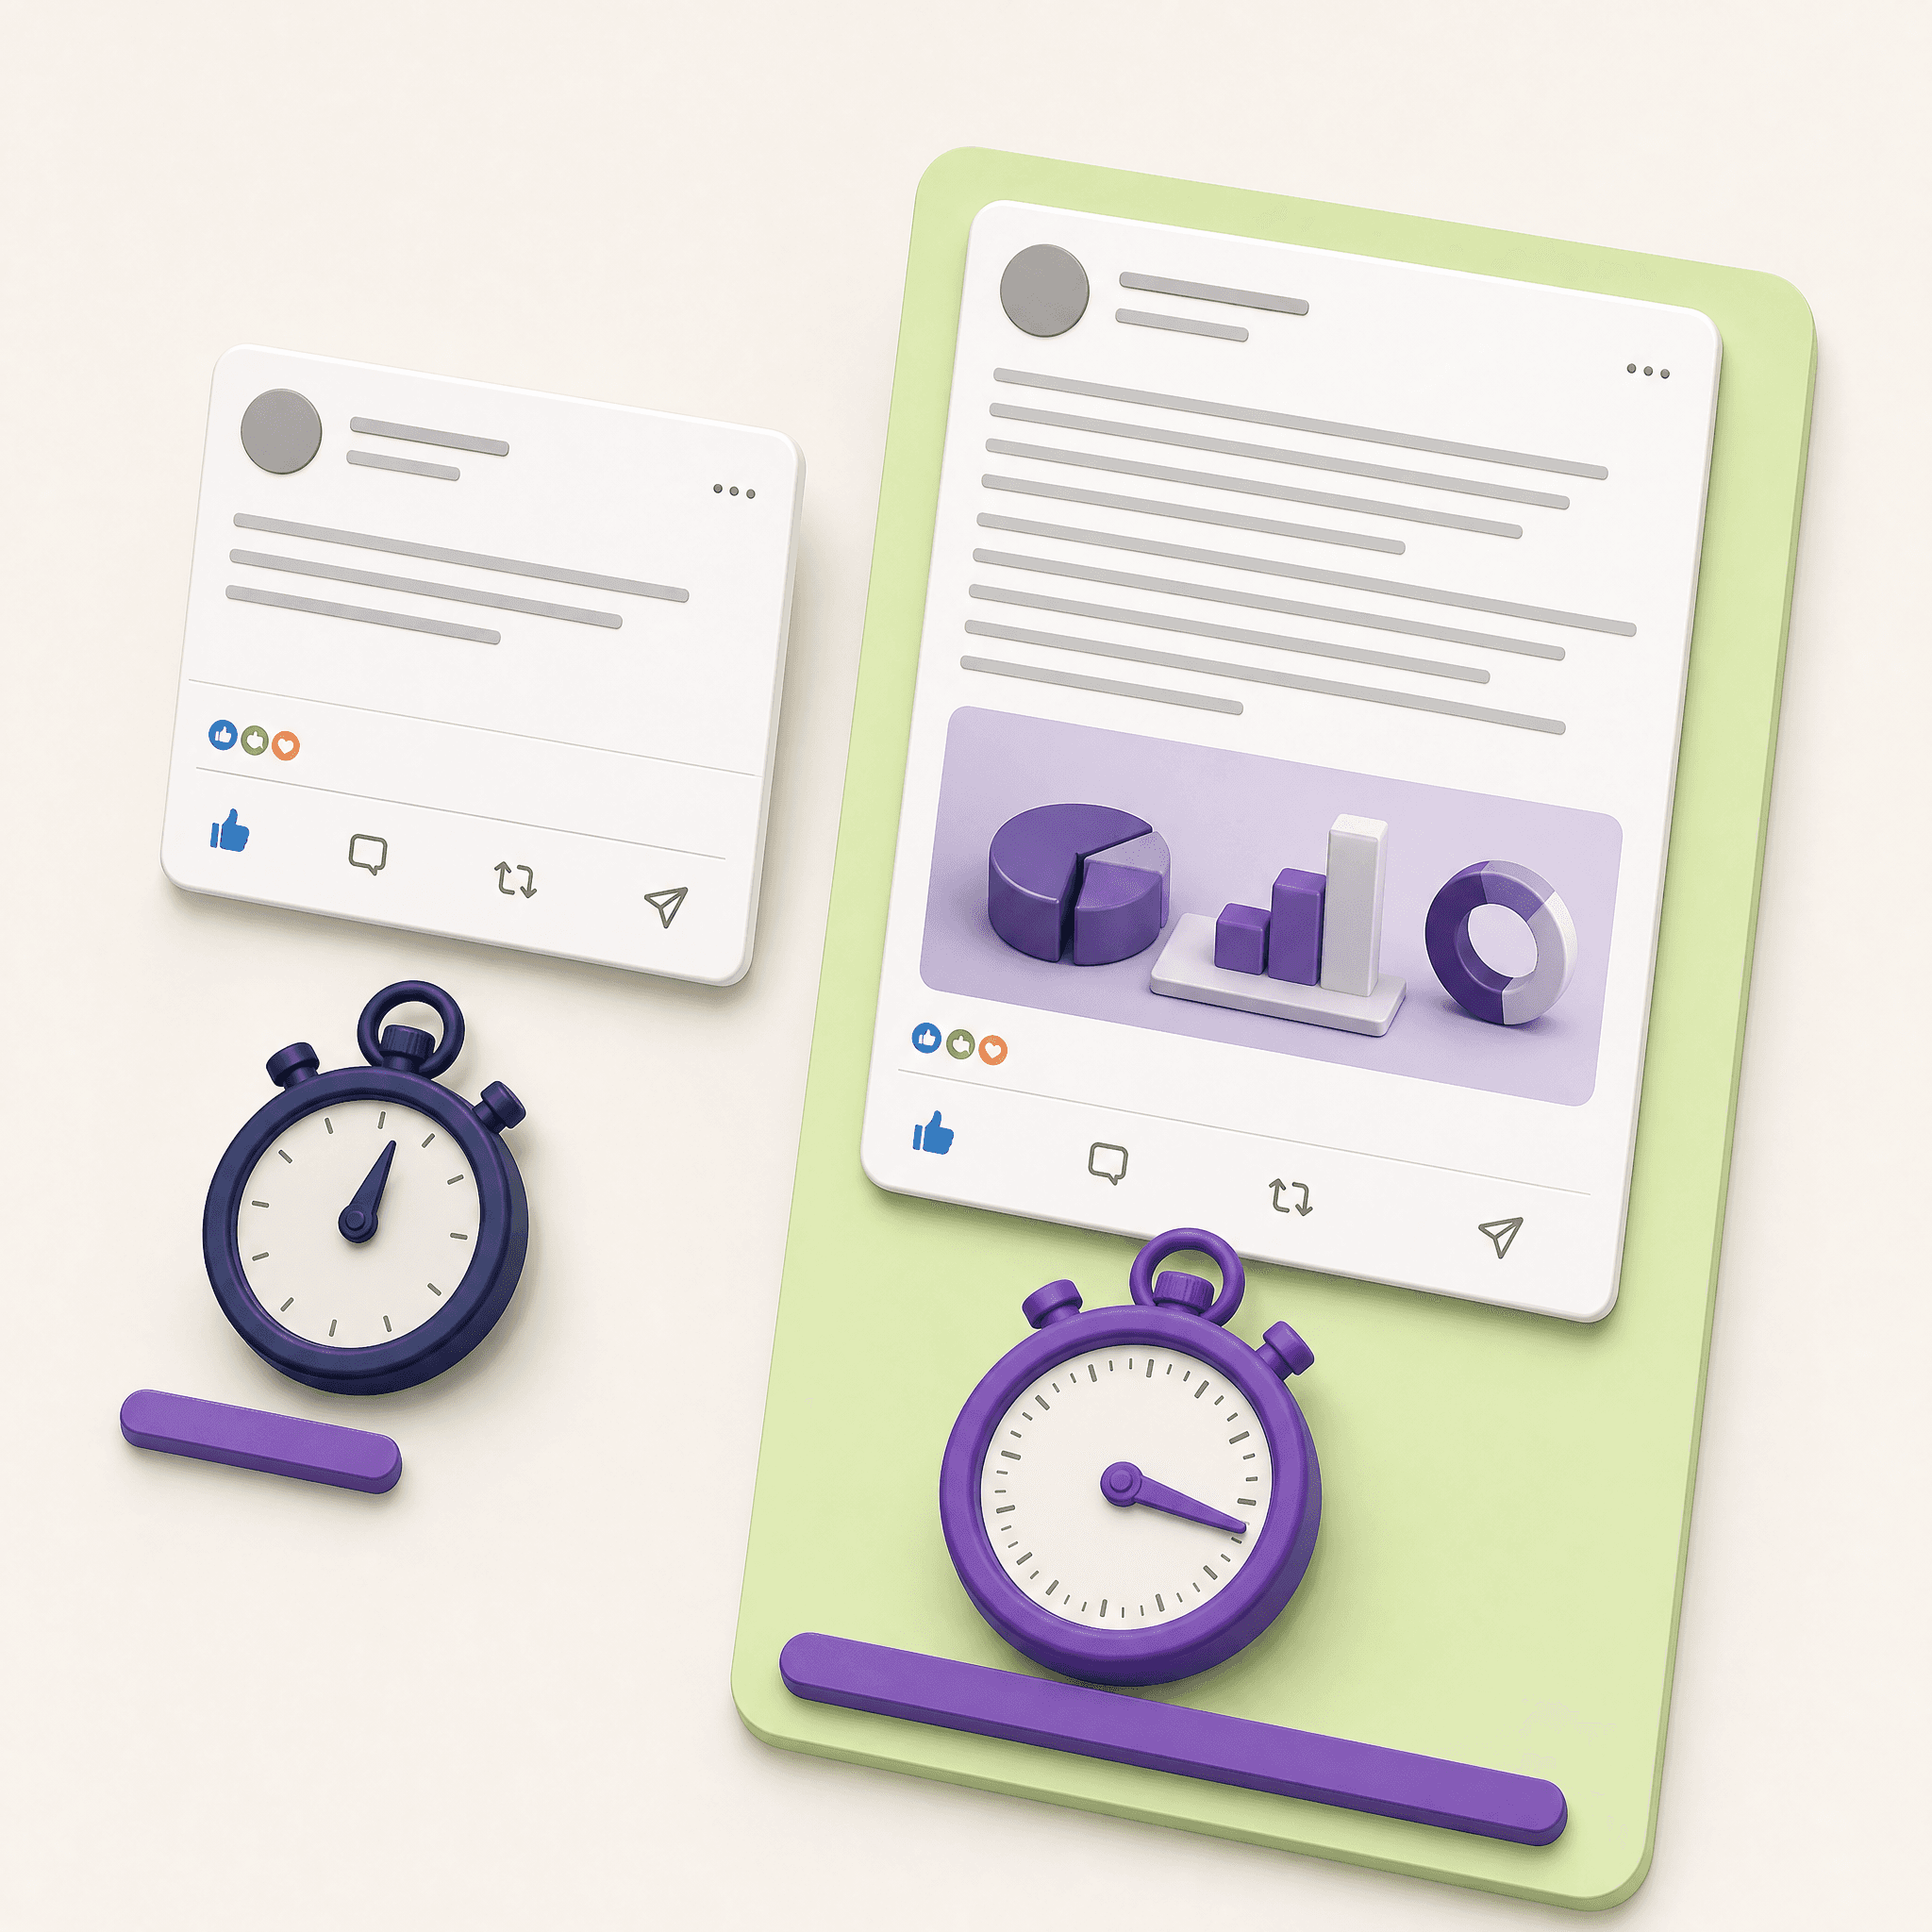
What does that do to writing? The three-lines-and-a-punchline post with a logo at the bottom, the one that worked in 2023, now stays with your close connections and never leaves them. The post that wins today opens with a claim, continues with a story or an example that forces a full read, and ends without dodging. A hook for the stay, not for the click.
Saves and sends
In 2025 everyone talked about comments, in 2026 the word is save. Metricool analyzed 673K posts from 63K accounts and found that a save carries 5x the ranking weight of a like and 2x a comment. Melanie Goodman, a UK LinkedIn consultant, claims saves raise the chance of entering the suggested feed by 60% or more. I couldn't verify that number against a second source, so take it as a signal, not a fact.
What is a fact: in September LinkedIn added Saves and Sends as per-post metrics in analytics. A platform doesn't expose a metric it doesn't measure. If it shows up in your dashboard, it counts.

So what makes people save? Things they want to come back to. Lists, templates, numbers with context, an explanation that saves them a search. An opinion post gets comments, a tool post gets saves. You need both in the mix.
Comments, including the ones you write
Three things happened to comments this year, and all three point the same way.
On August 9 LinkedIn changed the order of comments under a post: instead of chronological or by likes, each viewer sees the comments most relevant to them first. Meanwhile, time spent in comments is up 18% year over year (Microsoft's quarterly numbers). And in the official AI-visibility guidance from June 30, LinkedIn wrote it out: at least ten quality comments, because the models read those too.
The number that closed the loop for me came from Buffer, who studied 72K posts and found that the author replying to comments lifts total engagement by about 30%. SocialPilot cites Niall Ratcliffe's finding that the top 1% of creators reply 7.4x more often than everyone else (741%, if you prefer percentages).
Your comment is a distribution channel. Ten minutes of replies after posting is worth more than a second post.
Formats: carousel, video, collab posts
The document carousel (PDF) leads every measurement I saw this year, but the numbers don't agree with each other and it's worth understanding why. Socialinsider measured 7.00% engagement for documents in Q1, Influence Flow reported 6.6% to 7% in May, and Metricool found 3.71% with 1,451 average impressions per post, 11x the interactions of a single image. Three methodologies, three samples, so the exact figure matters less than the conclusion: everyone who measured, by any method, found the carousel first. The reason goes back to section one, every swipe is a few more seconds of reading time.
Video sits second, 4.7% per Influence Flow, and per SocialPilot a video that reaches 70% completion gets a 3.5x boost. I haven't seen that claim from any official source, so again, a signal. Metricool also found that "invisible interactions" (carousel swipes, video replays, "see more" clicks) now count as engagement.
And the format I find most interesting for small companies: Collab Posts, in beta since June. One post with two signatures goes out to both networks, and you can pair a personal profile with a company page. I covered it in full, it's the most elegant answer I've seen to "who gets the post, the CEO or the page."
Personal profiles
The number I warned you about in the opening. On August 17 Meltwater published an analysis of 9.5 million citations of LinkedIn content inside ChatGPT, Perplexity and Gemini answers. 75% came from personal profiles, company pages barely register.

Inside LinkedIn itself the picture is similar, and again with three numbers that look contradictory. Influence Flow talked in May about an 8x engagement gap in favor of the personal profile, Metricool measured a 2.60% engagement rate for personal profiles against 1.60% for company pages (63% higher), and company pages get roughly 5% of the feed overall. The gap between "8x" and "63%" is the gap between total interactions and engagement rate, different metrics, same direction.
What does it mean if you run marketing at a company? The company page is the house, and people's profiles are the doors. An employee advocacy program stopped being a nice-to-have. I collected profile examples that work separately.
What the algorithm punishes now
Generic AI content
This is the story of the summer, and since I've written about it twice I'll keep it short and just sort out the numbers floating around, because they're confusing.
The background: Pangram Labs found in July that 40.5% of long LinkedIn posts (250+ words) were fully AI-written, more than any other platform. In May LinkedIn announced suppression of generic AI content with a classifier that hit 94% accuracy in early tests, and even named one pattern that trips it: "it's not X, it's Y" (yes, the structure every language model is addicted to). On July 30 the report button arrived, and in August LinkedIn confirmed that over 1 million people used it in two weeks, that a post flagged by several reporters loses roughly 40% of its out-of-network reach, and that whoever gets flagged sees a private alert in analytics. In September they reported a 46% rise in inauthentic-activity detection, engagement pods included.

Now the confusion. Van der Blom said on the Creator Science podcast that an AI-written post gets 2.8x less reach and 5x less engagement. SocialPilot writes "30% less reach and 55% less engagement" and cites him. LinkedIn says 40%. The three numbers don't contradict each other, they measure different things: the official one measures the penalty on a reported post, van der Blom measures how AI posts perform in general (including ones nobody reported), and SocialPilot most likely quotes an older measurement of his. When someone throws "the AI penalty" number at you, ask what was measured.
One thing nobody talks about enough: a Stanford study found that AI detectors falsely flag 61.3% of texts written by non-native English speakers. If you write in English from Israel, your risk of being hit by a filter, and not only by a reader, is higher. One more reason to write in your voice and not the model's.
A link in the post body
The old rule said "link in the first comment, always." In 2026 the rule split, and that's why you see contradictory numbers online.
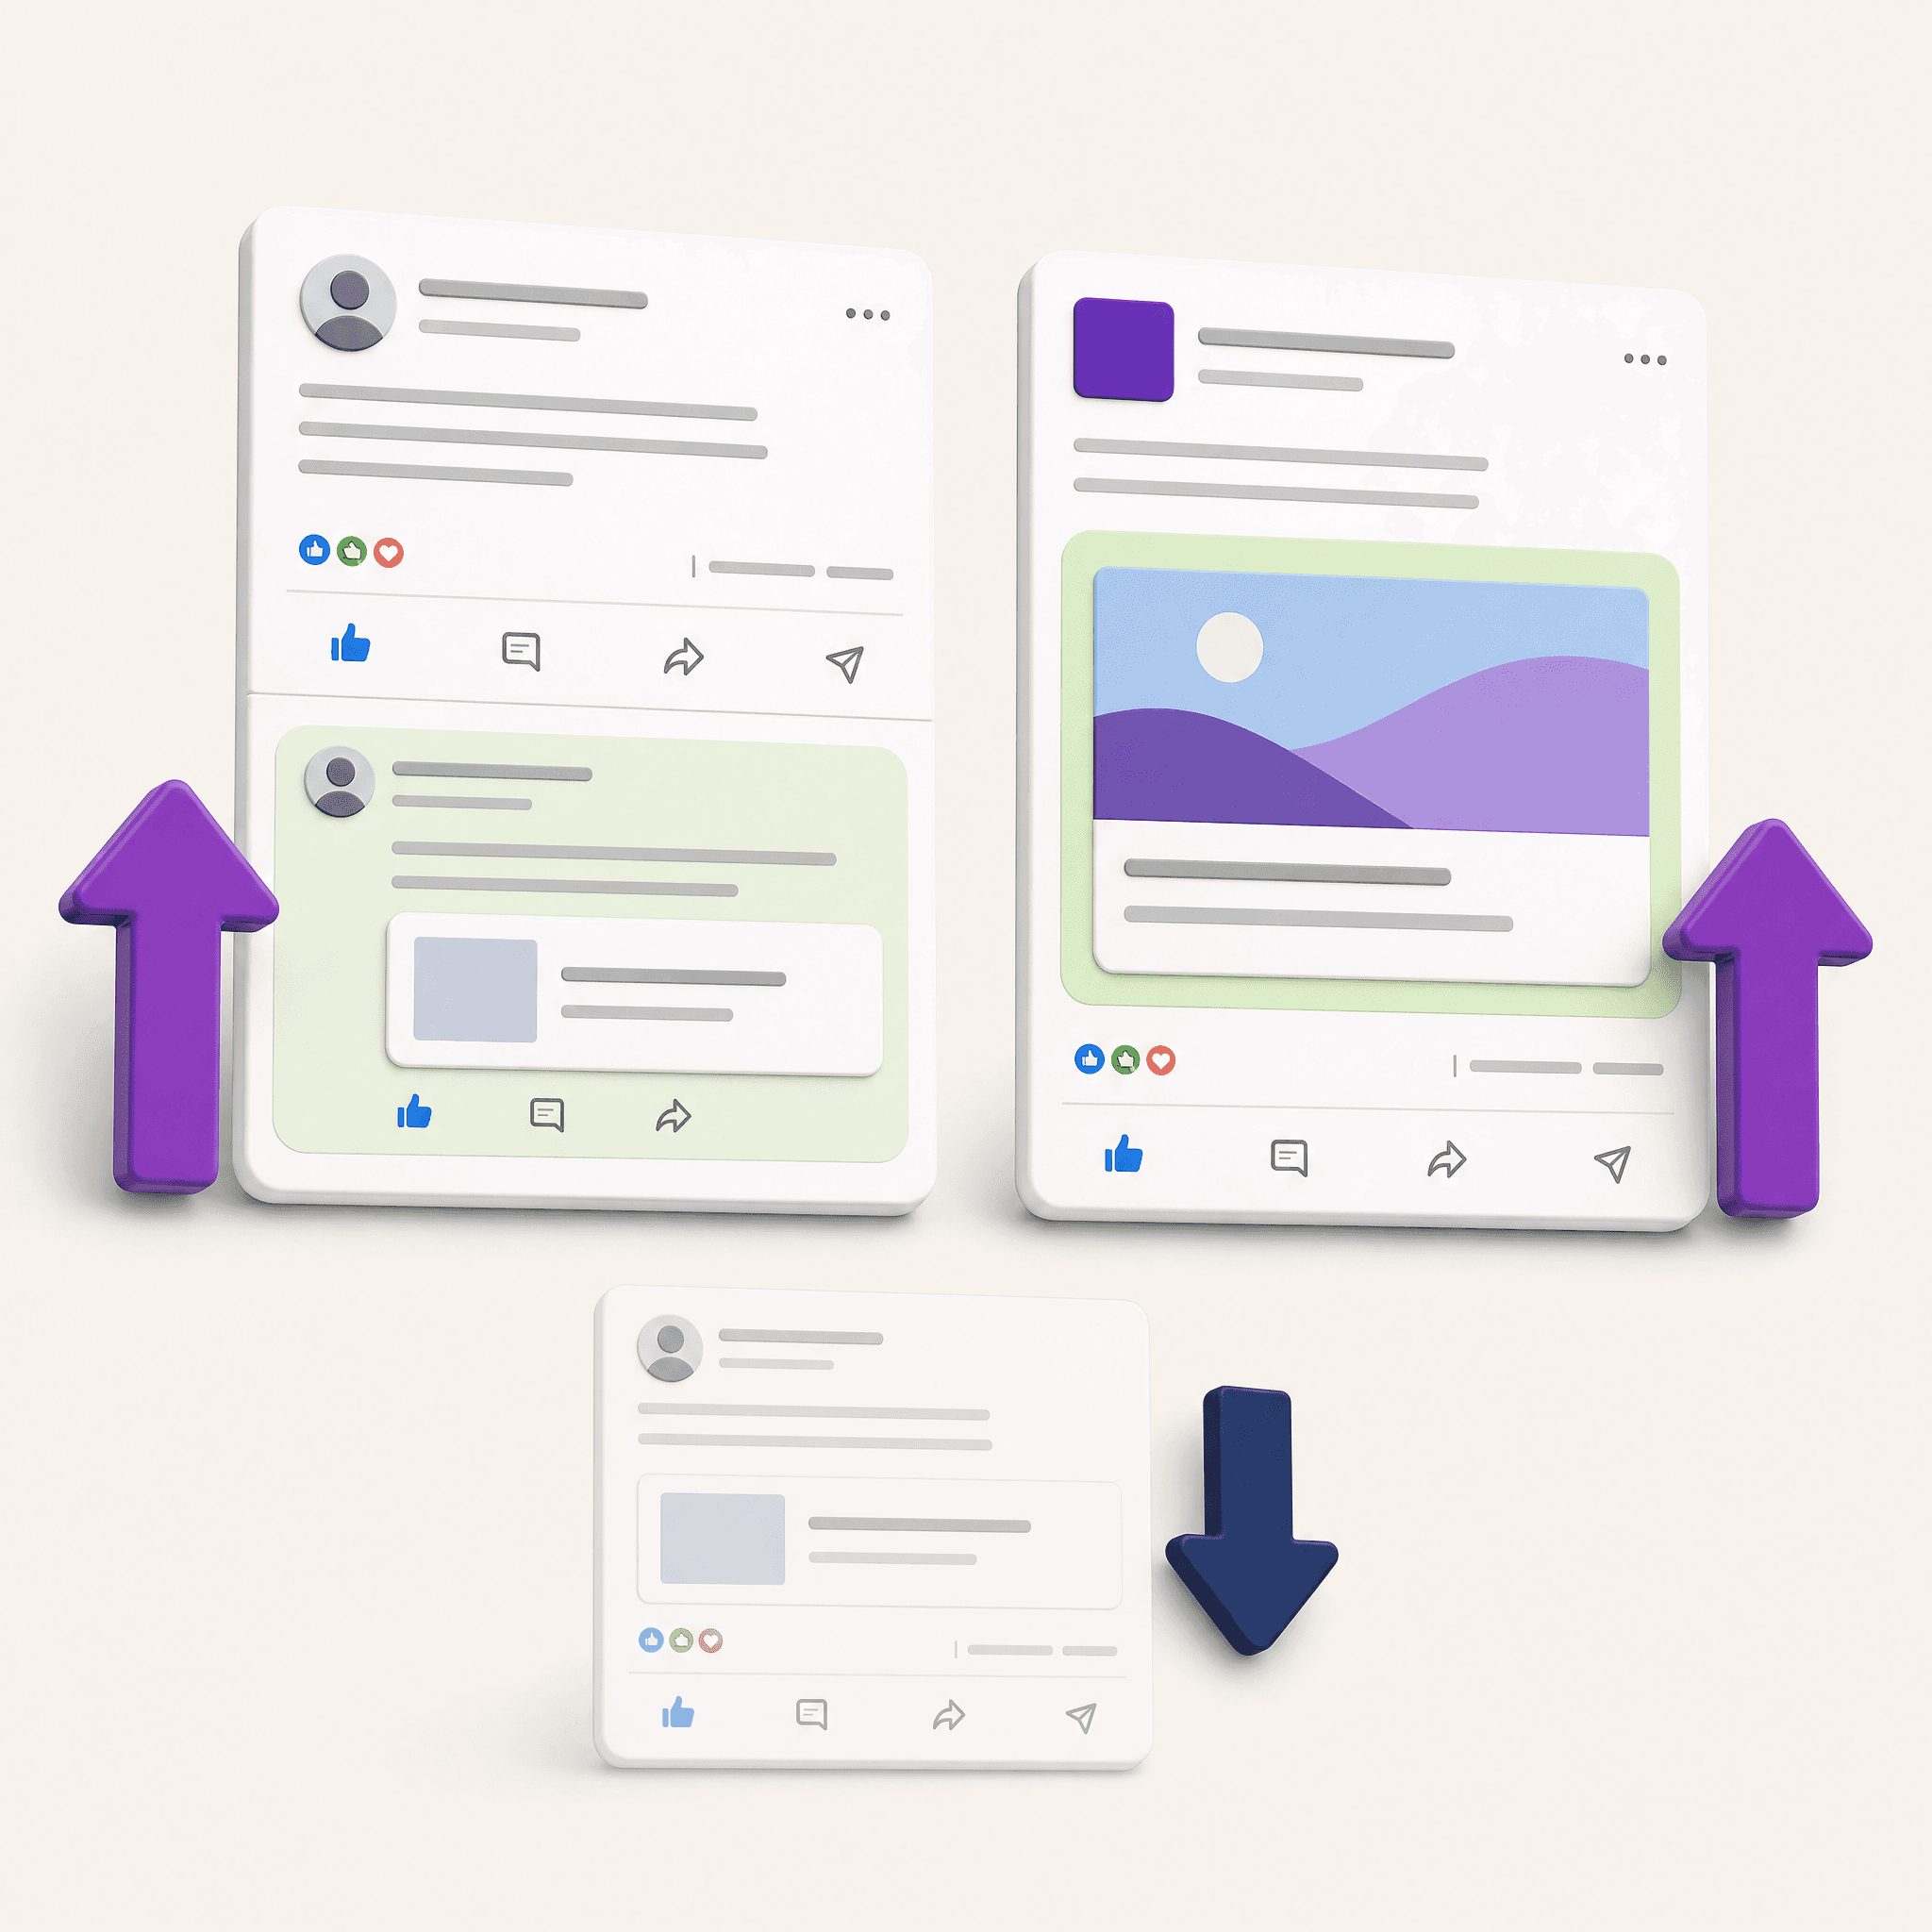
Van der Blom measured in May that a link in the body cuts median reach by 18.8%. Metricool measured 27% less reach in August, but only on personal profiles. On company pages they found the opposite: a link in the body added 51% impressions. MagicPost added one more detail (567K posts): the preview card is what gets penalized, a URL as plain text with no preview is barely touched.
SocialPilot's guide says "approximately 60% less reach" for any link, with no split between profile and page and no date. That's exactly the kind of number that travels from blog to blog and loses its context on the way. The updated rule: on a personal profile the link goes in the comment, on a company page it goes in the post.
The rest of the penalties
A few rules of thumb I work by, stated up front as experience rather than sample research: editing a post in its first hour resets part of the early test, a second post the same day steals reach from the first (the feed distributes one post per profile at a time), engagement bait like "tag three friends" is flagged by the May classifier, and hashtags no longer move anything in 2026, the model understands topic without them.
The money layer
Everything above connects to a layer that doesn't look like an algorithm but feeds it. In 2026 LinkedIn built a monetization engine for creators: Advice Sessions in May (paid consulting straight from the profile), Creator Marketplace in June, a July roadmap with paid subscriptions where the creator keeps 70% and paid events starting at 50 creators and scaling to 1,000. I laid out the whole model here.
Why does this touch the algorithm? Because a platform that earns from creators needs the good creators to get reach, and it defines "good" by what keeps people on the platform. Reading time, saves, comments. And in the other direction: a post flagged as AI slop is also a weak base for a Thought Leader Ad, because the ad is built on a post the feed already pushed down. Organic quality became a threshold condition for paid budget too.
And quietly, in August, SSI left the free account for Sales Navigator. Screenshot it if you can still see it.
A playbook for a B2B company, six things
Let's bring this down to earth. What do you do tomorrow morning with all of this?
Post 3 to 5 times a week, one post per day at most, in your audience's morning (for an Israeli audience, Sunday to Thursday between 8:00 and 11:00, from my experience rather than a study). Stay 10 to 15 minutes after publishing and answer every comment. Put the link in the first comment on a personal profile and in the body on a company page. Once a week, publish a post built to be saved (a list, a template, numbers with context), and once a week a carousel. Pair the CEO's profile with the company page through a Collab Post when both need the reach.
And on the writing itself: spoken language, in the voice of the person behind the profile. AI for the skeleton and the research, the sentences you write yourself. If a sentence sounds like one anyone could have written, the feed treats it that way.
The bottom line
LinkedIn in 2026 decided that what gets measured is the time a reader gives you and the trust they show through a save or a comment, and it built one model, a report button, a million reporters, a money engine and new analytics metrics around that. Every other change in the table is an extension of the same decision. It is also the base I build on for clients in the LinkedIn Growth Engine, profile, page and advocacy program as one system.
So what do you measure at the end of the month, likes or time and saves? And if it's still likes, what would it take to change that in your next conversation with the CEO?
FAQ
What is 360Brew and how does it affect LinkedIn reach?360Brew is a single 150-billion-parameter language model LinkedIn introduced in a March 2025 research paper and which became the feed's only ranking engine over 2026. It reads the post and the reader's history as text and ranks by relevance and reading time, not reaction counts. Per Search Engine Journal, organic reach fell 47% in its first year.
Is dwell time really a ranking signal on LinkedIn in 2026?LinkedIn hasn't published an official weight, but the data lines up: van der Blom measured 1.3 million posts in May 2026 and found 1.2% engagement for posts abandoned within 3 seconds against 15.6% for posts that hold readers 61 seconds or more. Metricool found that "invisible" interactions like carousel swipes are counted.
Does the AI slop button reduce reach?A single report does nothing, reports train the model. A post flagged by several reporters and confirmed by the automated classifier loses roughly 40% of its reach outside the author's network, per LinkedIn's official confirmation in August 2026. The author sees a private alert in analytics.
Personal profile or company page, which is better in 2026?Both have a role, but distribution favors the personal profile: 75% of LinkedIn citations in AI answers come from personal profiles (Meltwater, 9.5M citations), and the engagement rate on a personal profile is 63% higher than on a company page (Metricool). The exception: a link in the body adds 51% impressions on a company page and cuts 27% on a personal profile.
Which post format performs best on LinkedIn in 2026?The document carousel (PDF), in every measurement published this year. Figures range from 3.71% engagement (Metricool, 673K posts) to 7.00% (Socialinsider) depending on methodology, and in any case 11x the interactions of a single image. Native video is second.
How often should you post on LinkedIn in 2026?3 to 5 times a week, and no more than once a day, because the feed distributes one post per profile at a time. More important than the count: staying after publishing and replying to comments, which Buffer measured as a roughly 30% engagement lift across 72K posts.
Written by Hanita Yudovski. I run LinkedIn systems for B2B companies, from the CEO's profile to employee advocacy programs, and help independents build their presence on LinkedIn. LinkedIn is the field I work in every day, and the AI agents and tools I build myself are how the work gets done. Updated September 2026, this article is refreshed quarterly. Written with AI tools, with human strategy and editing.
Sources: 360Brew paper, arXiv · Richard van der Blom, algorithm research 2026 · Search Engine Journal: reach down 47% · Metricool: LinkedIn Trends 2026 · Social Media Today: 1M slop reports · TechCrunch: the slop button · Pangram Labs: AI in your feed · Stanford: detector bias · LinkedIn: AI visibility guidance · Semrush: citation study · Social Media Today: comment ranking · Social Media Today: inauthentic activity · Buffer: 72K posts · Socialinsider: benchmarks · Influence Flow: 2026 benchmarks · MagicPost: external links · van der Blom on Creator Science · Melanie Goodman: algorithm 2026 · SocialPilot: algorithm guide · Social Media Today: Q2 results